Find out more about The Public Practice Why use The Public Practice? Contact The Public Practice
Click to return to the site home page Read the latest about The Public Practice
 
INTERACTIVE TOOLS
Portrait Painters
Community Projector
Age Profiler
Community Explorer

Title

  Explorer control panel
exploere 2 explorer 1

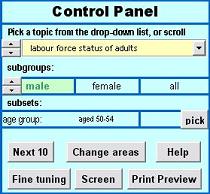
The Community Explorer runs in Excel™, with an on-screen Control Panel that lets you change the topic, people or period being examined.

You select a topic from the Control Panel, and the Community Explorer instantly updates, preparing a three-page, illustrated report to report on the chosen subject; ready to print, up-load, edit or cut-and-paste. For a sample report, click here.

The Community Explorer's report shows how your community is changing over time and how it compares with a second area (which you choose). There are 76 topics to explore.

Explorer bubble chart  
explorer 3 Explorer graph sample

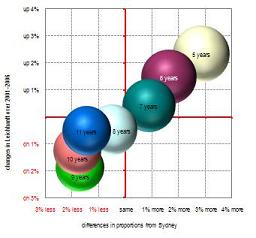
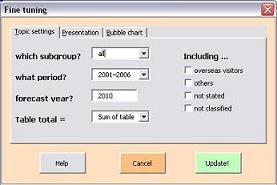
Our special bubble chart lets you spot anomalies and local features at a glance, while the written report explains the charts and tables and highlights your community’s characteristics. The Community Explorer also forecasts what might happen under current trends, to a year you nominate.

You can Fine Tune your report to look at one gender or alter the time period from 2001-2006 to 1996-2006. You can change the areas being compared with ease, or change the main bubble chart so it highlights a different aspect of your chosen topic. Further details on fine-tuning below.


Topics to select from include:

Population

  • ages of children, high-school teenagers, young people, Gen Y, Gen X, baby-boomers, mature adults, older people,
  • age groups of people, age groups of young people, age groups of older people, age decades of people
  • generations

Indigenous

  • types, ages, status of Indigenous people

Community Cultures

  • birthplaces: most common, most common foreign, other common, least common
  • ancestry: most common, other common, least common
  • languages spoken: English-speaking, most common, other common, least common
  • religion: religious beliefs of people, most and least common churches of Christians

Education

  • education systems of all students
  • school types: infants/primary, secondary, all students
  • attendance patterns of students: TAFE, university, tertiary

Housing

  • types of households
  • structure of dwellings
  • tenure: dwellings, houses, attached houses, flats/units
  • rented dwellings
  • monthly mortgage repayments
  • resident mobility: 1 yr, 5 yr

Employment

  • tertiary qualifications of adults, qualification fields of adults
  • age groups: full-time workers, part-time workers, workers away from work, employed adults, adults looking for full-time work, adults looking for part-time work, unemployed adults, labour force, adults not in labour force
  • labour force status of adults
  • main industries, smaller industries, industries, occupations

Specifications

  Explorer sample topic report
expl exp

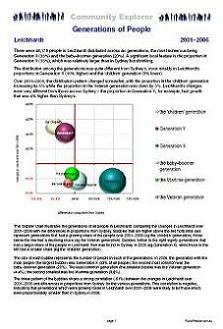
The Community Explorer uses the ABS Time Series Profile (TSP), which is available for any area down to a Statistical Local Area or postcode, free of charge from the ABS web site.

Page 1 has a paragraph of text describing the most characteristic features of the chosen topic. This is also illustrated by a bubble chart which shows how the proportion of people in each category of the topic (e.g. generations) varies for the selected community over time and compared with your second area.

Page 2 has a bar chart comparing the proportion in each category with your second area, and descriptive text highlighting the most interesting features. The bar chart shows the past trend projected to your chosen year.

Page 3 This page has the data tables giving the number of males and females in the chosen age-sex group, by category.


Fine-tuning

Selecting Fine Tuning on the Control Panel opens up a new set of choices:

  • Subgroups: you can select whether to analyse all people, males, or females where relevant. Some topics also have topic-specific sub-groups to select from.
  •   Explorer fine-tuning control panel
    exp exp
  • Period: you pick whether you want to look at 1996–2001, 1991–2001 or 1991–1996.
  • Forecast: you enter the year (e.g. 2010) you want forecasts made to. Changes are projected forward to the year set and are shown on the bar chart.
  • Inclusions: You can choose whether to include overseas visitors or ‘not stated’, ‘not classified’ or ‘other’ responses in the analysis.
  • Help: There is on-line help on using the Explorer and refining your reports.

Samples

Download a PDF report sample, or email us for an interactive Excel™ sample.

Price

The Community Explorer is $3,600 plus GST, and comes loaded with your area and your chosen comparison area. Get an order form here.