Interactive investigation of age groupsThe Age Profiler is Excel™-based software that analyses and reports on the characteristics of the age-groups in your community. You simply pick the age group, the sex, and the topic from the drop-down menus. In seconds, the Age Profiler prepares a four-page illustrated report on the topic. You need no Excel experience to work it. Using the Control Panel, you can scroll through the topics, age groups and sexes, and watch as characteristics change. The written report explains the many charts and tables and highlights key characteristics of the selected age group.
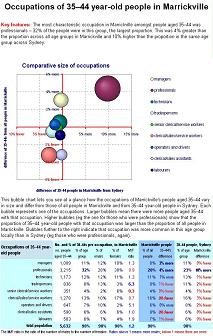
Our special bubble chart lets you spot anomalies and local features at a glance, by comparing the selected age group with the overall community and with the same age-sex group in a wider community. Another chart (below) highlights how age groups compares. SpecificationsThe Age Profiler uses the ABS Expanded Community Profile data, available for every Local Government Area, region and state, as well as the Basic Community Profile data used in most social profiles. We provide the Age Profiler with your data already loaded. If you want other areas, the data is available free from the ABS over the web, and the Age Profiler loads it for analysis, with ease. It takes just a couple of minutes. The Age Profiler runs in Excel™. You pick a topic, age group and sex from the Control Panel, and the Age Profiler prepares a four-page analytic report, ready to print if you want. This takes a few seconds. You can print all or part of any report, or cut-and-paste text, charts or tables into another report. If you want, you can edit the text before printing to improve the analysis, or adapt the style of the charts, tables and text to suit your taste. A useful way of understanding how your place's characteristics change with age is to pick a topic and gender, then just flick through the age groups at the click of a button. You see the bubbles on the top chart move with each change. Sudden changes are easy to spot when the bubbles change. The reportPage 1: (illustrated above) The top of this page is visible on your screen on start-up, with a paragraph of text describing the most characteristic feature of the chosen topic among the selected age-sex group, illustrated by a bubble chart. The bubble chart shows how the proportion in each category of the topic (e.g. birthplaces) varies for the selected age-sex group from all people in your community and from the same age-sex group across Australia.
Page 2: This page has more text describing how the age-sex group is distributed among the categories, and how this varies from other age groups, other places, and between the sexes. This is illustrated by bar charts. Page 3: On this page, the distribution of the chosen age-sex group among the categories is compared across all ages and illustrated with an ‘area’ chart (sample right). Page 4: This page has the data tables giving the number of males and females in the chosen age-sex group, by category. The Control Panel
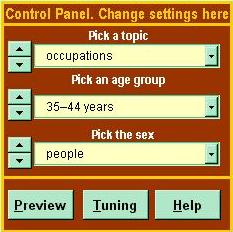
The Control Panel appears on your Excel screen when you open the Age Profiler, on the right side. From here, you select the topic, age group and gender. Click the right-side down arrow, and a menu of options drops down. Pick any. As soon as you change any option, the Age Profiler report is updated so it examines (say) the occupations of all people aged 35-44. You can Fine Tune the analysis by clicking the Tuning button, get help from the Help button, or preview and/or print your report using Preview. The up and down arrows beside the three options allow you to scroll up and down through topics, age groups or genders. Topic OptionsThere are about 30 topics covering six themes: Birthplaces: main, main foreign, less common, least common, regions There are 8 age groups to select from: 0–14; 15–24; 25–34; 35–44; 45–54; 55–64; 65–74; 75+ years. There are 3 gender options to select from: males, females and people. Not all topics have data on the 0–14 and 75+ age groups. Most topics have data for males and females; a few for people only. Tuning
You can set the print area for any combination of the four pages or any selected range in the report; You choose whether to include overseas visitors, ‘not stated’, ‘not classified’ or ‘other’ responses in your tables and totals. You can adjust the characters per line to refine the report's paragraph spacing. You can show the title on the chart, for copying to another document. The chart title is normally hidden as it duplicates the page title. The Age Profiler defaults to colour printing, which works well on most black-and-white printers as shades of grey. However, you can switch to Excel's black-and-white print mode, which may work better for you. Loading dataThe Age Profiler will open your web browser at the ABS AusStats web site where you get the needed data without charge. When it is downloaded and unzipped, which takes a couple of minutes, you click the Age Profiler’s [Load data] button to install the data you bought. You can change the comparison area (Australia comes loaded with the Age Profiler) to your local region, city or state just as easily, once you download their data from the ABS. PriceThe Age Profiler costs $3,600 plus GST, and comes loaded with your place's data and that of Australia as a comparison. To order, download an order form here. View a sample Profiler report as a PDF. Email us for a working demonstration version. |
|||||||||||||||||||||||||