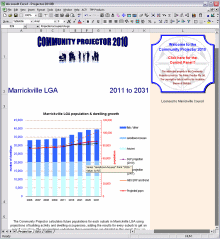
Census 2011 Upgrade coming! The Community Projector is a crucial tool for growth areas. It uses Census and more recent data to prepare dwelling, occupancy and population projections across your suburbs or districts. Projections are made for houses, attached houses, flats and non-private dwellings, and for dwellings of different size within each type.
You can tune the Projector so its calculated population matches another projection, and see the dwelling implications. Or alter the dwelling forecasts and see the population implications. The Community Projector is interactive software running is Excel. You can change assumptions and insert your own data. Once you have tuned the model, you click [Update] to recalculate the projected population, dwellings and vehicles in each locality in any future year. The Projector updates its chart and text whenever you change the assumptions. It prints as a full-colour 27-page report with an Executive Summary, explanatory text, and over 50 tables through which the calculations occur. You can easily print a set of reports showing the impact of different assumptions. Or cut-and-paste sections into other documents. MethodologyThe Community Projector is loaded with dwelling and occupancy data for all your suburbs for the last two censuses. Using this, it calculates the annual change rates in occupancy rates and dwelling numbers (for all main types of dwellings) for all localities. The Projector calculates the dwelling numbers and occupancy rates resulting from this trend, and the consequent population, for each locality for any chosen year. The Projector then uses Census 2001 and 2006 date to calculate the number of dwellings of different size, the number of bedrooms they contain, and the bedroom occupancy rate for dwellings of different size. It calculates the number of dwellings and bedrooms resulting from your growth scenario. Using this information, The Projector then calculates the contribution to population growth from new dwellings, and shows how a capital cost attributable to population growth can be fairly charted among new dwellings and internal growth (from occupancy changes in existing dwellings). All the assumptions in the Projector are explicit and can be altered, based on local knowledge and wider trends. Default assumptions can be overridden by using local knowledge of building opportunities. This is an important step in refining the projections. The Projector is a calculating tool that allows planners to test the implications of various scenarios for dwelling construction and occupancy rate changes, in order to establish a set of consistent assumptions that accord with population estimates derived by other means (e.g. from ABS forecasts or other demographic models that use birth, death and migration rates). You can enter assumptions into The Projector either directly onto the spreadsheet, or by using the Control Panel, which you can activate at any time. SpecificationsThe Community Projector runs in Excel™. It comes loaded with Census data for up to 20 localities you choose, which comprise your Council or region. We load your initial data into the Projector. Generally, the data for all Census Collectors Districts is loaded, and these are aggregated into the localities you want (e.g. suburbs, districts, wards). The Projector is also loaded with data on the recent estimate resident population (to 2009) and dwelling approvals for your area. As well, tables are extracted from the Expanded Community Profile for your area. The Projector report itself explains its methodology in more detail. The report is 27 pages long, with a five-page Executive Summary. The Projector comes with a User Manual that explains how it works and how to alter any assumptions. PriceThe Community Projector costs $6,950 plus GST, and comes loaded with the housing and population data from the last two Censuses, available projections, and recent ABS building and population estimates for your area. The price includes the User Manual, training and support for 12 months, helping your staff use the program and establish realistic projections. Order here.
|
|||||||||||||

