 |
||||||||||||||
| Tracking the Gaps | ||||||||||||||
| Australia | ||||||||||||||
| A portrait of the Indigenous community of Australia, compared with NSW, from the 2011 and earlier Censuses. | ||||||||||||||
| Contents | ||||||||||||||
| Overvie | Snapshot | 2 | ||||||||||||
| Preface | 3 | |||||||||||||
| Tracking Indigenous differences in Australia | 4 | |||||||||||||
| Population | Indigenous population & growth | 5 | ||||||||||||
| Life Stages | 6 | |||||||||||||
| Age profile | 7 | |||||||||||||
| Population Features | 8 | |||||||||||||
| Generations | 9 | |||||||||||||
| Households | Households types & sizes | 10 | ||||||||||||
| Household Features | 11 | |||||||||||||
| Types of housing | 12 | |||||||||||||
| Housing tenure | 13 | |||||||||||||
| Housing Gap Indicators | 14 | |||||||||||||
| Incomes | Individual incomes | 15 | ||||||||||||
| Household incomes | 16 | |||||||||||||
| Income Gap Indicators | 17 | |||||||||||||
| Capacities | Current education | 18 | ||||||||||||
| Schooling levels | 19 | |||||||||||||
| Internet connections | 20 | |||||||||||||
| Education Gap Indicators | 21 | |||||||||||||
| Disability Levels | 23 | |||||||||||||
| Disability care given | 24 | |||||||||||||
| Disability Gap Indicators | 25 | |||||||||||||
| Second Edition | Employment | |||||||||||||
| Tertiary qualifications | ||||||||||||||
| Qualifications by age | ||||||||||||||
| Prepared as a sample only. Not for reproduction. | ||||||||||||||
| Indigenous Snapshot Australia 2011 | ||||||||||||||
| z | In the 2011 Census, 548,370 Indigenous people were counted in Australia, of whom 90% were Aboriginal. | |||||||||||||
| € | Between 2006 and 2011, the Indigenous population counted rose by 21% from 455,031, while the total population rose by 8%. | |||||||||||||
| € | About 12% of population were under 5 in 2011, accounting for three-quarters of the counted population growth from 2006. | |||||||||||||
| € | The ABS estimates that the Census undercounts the Indigenous population by 17% nationally, so on average the Indigenous population is one-fifth larger than counted. | |||||||||||||
| z | The Indigenous community is much younger than Australia's non-Indigenous population, with a median age of 21 vs 38 years. | |||||||||||||
| € | There was a much higher proportion under 18 years old, 43% to 23%. | |||||||||||||
| € | There was a much lower proportion aged 65 or more, 4% to 14%. | |||||||||||||
| z | Indigenous households had an average of 3.3 residents in 2011, which was little changed since 2006, and 29% larger than non-Indigenous households in Australia. | |||||||||||||
| € | Three-tenths of Indigenous households were couples with children. | |||||||||||||
| € | One-quarter were one-parent families. | |||||||||||||
| € | 14% of the Indigenous households were lone persons but 25% of other households were. | |||||||||||||
| z | Indigenous households most commonly lived in dwellings that were rented (59% of households). Another 25% lived in dwellings that were being purchased. | |||||||||||||
| € | In all, 36% of Indigenous households in Australia were either buying or owning their home, which was up by 2% since 2006. | |||||||||||||
| z | In 2011, the median income of Australia's Indigenous adults (aged 15+) was about $362 a week, which was 38% less than the average of all adults in Australia ($582.) | |||||||||||||
| € | The median income gap had closed by 3% since 2006. | |||||||||||||
| z | Three in every ten Indigenous residents (173,516 people) were attending an educational institution in 2011. | |||||||||||||
| € | 81,556 Indigenous people had completed Year 12, which was 48% more than in 2006 and 95% more than in 2001.. However, there were ... | |||||||||||||
| € | 24% fewer Indigenous 2024 yearolds in education, compared to others that age | |||||||||||||
| € | 23% fewer Indigenous 1519 yearolds in education, than others. | |||||||||||||
| z | 29,559 Indigenous people reported that they had a severe and chronic disability, 5.4% of the population. | |||||||||||||
| € | Indigenous people had higher disability rates than others in most age groups. | |||||||||||||
| € | For 4554 year-olds, the Indigenous disability rate was 2.7 times that of others. | |||||||||||||
| € | For 5564 year-olds, the Indigenous rate was 2.7 times that of others . | |||||||||||||
| € | 13% of Indigenous adults gave assistance to a person with a severe disability. | |||||||||||||
| z | In 2011, 63% of Australia's Indigenous households had an Internet connection, which was 22% more than in 2006. | |||||||||||||
| Preface | ||||||||||||||
| This report paints a picture of the Indigenous community of Australia using data from the 2001, 2006 and 2011 Censuses. | ||||||||||||||
| A range of well-being indicators are calculated for both the Indigenous and non-Indigenous populations, and differences or gaps are calculated. Trends in these gaps have been monitored over the decade. | ||||||||||||||
| Who is included? | The people
described in the Portrait usually lived in Australia in 2011, even if they
completed the Census away from home. They lived here for at least half of
2011. People who were visiting Australia on Census night are not
included. The 2001 data is of the Census-night population, not residents, so comparisons with 2001 are less accurate. |
|||||||||||||
| Who are Indigenous? | Indigenous people,
in this Portrait, means all people who, in completing the Census, responded
that they had Aboriginal or Torres Strait Islander origins. Note that the Census question is about origins, and does not ask whether people identify as Indigenous in their daily lives. |
|||||||||||||
| Are all Indigenous people counted? | Of course not all
Indigenous people completed the Census and identified their origins. While
2.5% of the Census respondents said they had Indigenous origins, another 4.9%
did not answer this question. The ABS estimates that nationally, the Indigenous 'undercount' was 17%. This means that on average, the Indigenous population was about 20% higher than counted. It could be 30% higher in remote regions. However, for most communities, the Census is a valuable source of information. |
|||||||||||||
| National trends | Nationally, the number of Indigenous people counted in the Census rose by a fifth (21%) between 2006 and 2011. Almost three-quarters of the increase was from births, the rest was caused by more people identifying Indigenous origins than in the previous Census. This was most pronounced among people born 19551979 and their children. | |||||||||||||
| Sources of data | The data for this report is drawn from the Population Profiles for Australia and NSW published by the ABS from the 2001, 2006 and 2011 Censuses. The data tables used for this report are in a separate attachment. | |||||||||||||
| Indigenous Population Profile | Basic Community Profile | |||||||||||||
| Australia | NSW | Australia | NSW | |||||||||||
| 2011 | IP_0.XLS | IP_1.XLS | BCP_0.XLS | BCP_1.XLS | ||||||||||
| 2006 | 20020-IP-Australia.xls | 20020-IP-New South Wales.xls | 20010-BCP-Australia.xls | |||||||||||
| 2001 | IPP_0.xls | IPP_1.xls | ||||||||||||
| This report is published from an Excel spreadsheet. Most of the charts in this report are interactive, and can be changed in the Excel version to compare the characteristics of the local Indigenous population in 2011 with other communities or other Censuses. | ||||||||||||||
| Version M of 23/08/2012 | ||||||||||||||
| Copyright and disclaimer | ||||||||||||||
| While care has been taken to ensure that this report accurately transcribes and reports on data loaded from the Australian Bureau of Statistics website, neither The Public Practice nor the Australian Bureau of Statistics, nor any publisher or distributor of this Portrait, in whatever format, gives any guarantee that this report is accurate and correct in every detail. Before making important decisions, you are advised to check the data and calculations yourself using original data sources. | ||||||||||||||
| The copyright in all Census data is held by the Australian Bureau of Statistics (ABS) for the Commonwealth of Australia. The copyright in the design, text and software code used in this product, called a Portrait, is held by The Public Practice Pty Ltd, ABN 003 052 140. Reproduction of this report in electronic or physical form requires a licence from The Public Practice and may require the consent of the Australian Bureau of Statistics. | ||||||||||||||
| Tracking Indigenous differences in Australia | ||||||||||||||
| In the table below, some indicators of community structure and well-being are calculated for Indigenous people in Australia. The difference or gap with non-Indigenous people is calculated for 2011. Using three Censuses, the gaps are tracked over 20062011, and the previous five years, 20012006. | ||||||||||||||
| this colour indicates the gap was closing | this colour indicates the gap was fairly stable | this colour indicates the gap was widening | ||||||||||||
| rates in 2011 | ||||||||||||||
| Indicator | Indig in Aust |
non-Indig in Aust |
Size of Gap in 2011 | Gap Change 2006-2011 | Gap Change 2001-2006 | |||||||||
| The elder difference | 4% | 14% | 10% less | same | 1% wider | |||||||||
| Indicator: % aged 65+ in population | ||||||||||||||
| The dependency difference | 1.5 | 2.0 | 25% less | 5% less | 2% less | |||||||||
| Indicator: ratio of dependent age to working age | ||||||||||||||
| The single parent difference | 46% | 24% | 22% more | same | 7% wider | |||||||||
| Indicator: % of families with children having one parent | ||||||||||||||
| The family size difference | 4.5 | 4.0 | 13% more | 3% wider | 5% less | |||||||||
| Indicator: average size of couple families with children | ||||||||||||||
| The home ownership gap | 36% | 68% | 32% less | 3% less | 4% less | |||||||||
| Indicator: % of households owning/buying their home | ||||||||||||||
| The personal income gap | $362 | $582 | 38% less | 3% less | 12% wider | |||||||||
| Indicator: median weekly income of adults (15+) | ||||||||||||||
| The household income gap | $991 | $1,241 | 20% less | 3% less | 10% wider | |||||||||
| Indicator: median income of households | ||||||||||||||
| The pre-school gap | 18% | 20% | 2% less | 2% less | - | |||||||||
| Indicator: % of infants under 5 in education | ||||||||||||||
| The teenage education gap | 52% | 75% | 23% less | 4% less | same | |||||||||
| Indicator: % of 1519 year-olds in education | ||||||||||||||
| The schooling gap | 85% | 93% | 8% less | 2% less | 2% wider | |||||||||
| Indicator: % of 5-14 year olds in education | ||||||||||||||
| The Year 12 gap | 25% | 52% | 27% less | 1% wider | 3% wider | |||||||||
| Indicator: % of adults 15+ completed 12 years school | ||||||||||||||
| The schooling years gap | 10.0 yrs | 10.8 yrs | 0.8 yrs | 0.2 yrs less | 0.1 yrs less | |||||||||
| Indicator: average number of years school of adults | ||||||||||||||
| The Internet gap | 63% | 77% | 14% less | 7% less | 18% wider | |||||||||
| Indicator: % of households with an Internet connection | ||||||||||||||
| The disability gap | 5.4% | 4.6% | 0.7% more | 0.6% wider | n.a. | |||||||||
| Indicator: % of adults with a chronic, severe disability | ||||||||||||||
| Indigenous population & growth | ||||||||||||||
| In the 2011 Census, Australia's Indigenous population was counted as 548,370 people, of whom 495,757 identified as Aboriginal and 31,407 as Torres Strait Islander; 21,206 identified as both Aboriginal & TSI. | ||||||||||||||
| z | Indigenous people were 2.5% of Australia's population, which was similar to NSW (2.5%). | 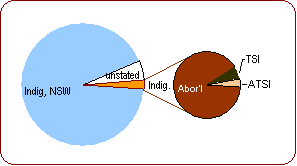 |
||||||||||||
| However, 4.9% of the population did not say whether or not they had Indigenous origins | ||||||||||||||
| z | There were more Indigenous women than men, with 103 females per 100 males | |||||||||||||
| There were also 103 females per 100 males among non-Indigenous people. | ||||||||||||||
| z | The ABS estimates that the Census undercounts the Indigenous population by 17% nationally, so on average the Indigenous population is one-fifth larger than counted. | |||||||||||||
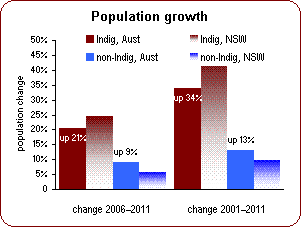
| Between 2006 and 2011, Australia's counted Indigenous population rose by 21% (from 455,031); the total population rose by 8%. | ||||||||||||||
| Across Australia, the counted Indigenous population rose 21%, with almost three-quarters of this growth due to births (infants under 5), and the rest due to more people in most age groups identifying Indigenous origins in the Census. This continues a trend since 2001. |
|
|||||||||||||
| z | Between 2001 and 2011, Australia's counted Indigenous population rose by 34% (from 410,003). | |||||||||||||
| Australia's non-Indigenous population rose by 13% over the decade. | ||||||||||||||
| The Indigenous population counted in NSW rose by 44% over the decade. | ||||||||||||||
| On Census night 2011, about 510,564 of Australia's Indigenous residents were at home, 93% of the population, while 37,807 or 7% were away from home. Offsetting this, there were 37,804 Indigenous visitors, equivalent to 7% of the local Indigenous population. | ||||||||||||||
| z | 3,146 of the visitors were from the same locality, possibly staying with relatives. | 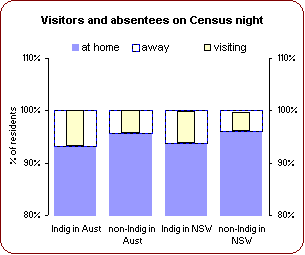 |
||||||||||||
| Of the rest, 26% were from New South Wales and 26% were from Queensland. | ||||||||||||||
| z | The proportion of Indigenous residents away from home was similar to 2006. | |||||||||||||
| The proportion away from home was 2% higher than for other residents of Australia; it was similar to Indigenous residents of NSW. | ||||||||||||||
| z | The number of Indigenous visitors was up 6,954 from 2006, when they were 7% of the local Indigenous population. | |||||||||||||
| 4% of the non-Indigenous population of Australia were visitors on Census night. | ||||||||||||||
| Life Stages | ||||||||||||||
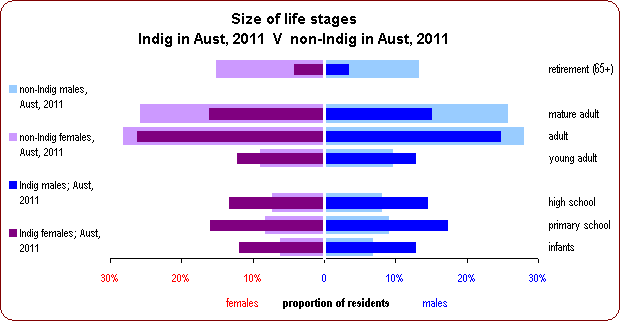
| Australia's Indigenous population had a much larger proportion in the dependent stages of life children plus aged compared with the non-Indigenous population. This meant there was a higher 'dependency ratio' on average, each person of working age had many more dependents to support. | ||||||||||||||
 |
||||||||||||||
| In Australia's Indigenous population in 2011 ... | More details | |||||||||||||
| z | Over five in every ten (53%) were prime age adults (aged 1864). | The proportion of prime age was 10% lower than for Australia's non-Indigenous residents (63%). | ||||||||||||
| 12% were aged 1824, 25% of residents were aged 2544, 16% were aged 4564. |
Compared with Australia's non-Indigenous people, 3% more were young adults (1824 yrs) but 10% fewer were mature adults (4564 yrs). | |||||||||||||
| The number of prime-age adults was up 24% from 2006; and up 39% from 2001. | Prime age adults were 52% of the Indigenous community in NSW, with the number this age having risen by 28% since 2006. | |||||||||||||
| z | Four in every ten Indigenous residents (43%) were children under 18. | The proportion who were children was 20% higher than for non-Indigenous people in Australia. | ||||||||||||
| The number of children was up 16% from 2006; and up 25% from 2001. | Children were 43% of the Indigenous community in NSW; the number there was up 19% since 2006. | |||||||||||||
| The largest stages among the children were primary school (17%), then high school (14%) and infants (12%). | ||||||||||||||
| z | Only 4% of Indigenous residents were of retirement age, 65+ years. | 14% of non-Indigenous people in Australia were of retirement age. | ||||||||||||
| However, the number this age was up 37% from 2006; and up 82% from 2001. The change from 2001 was noticeably less than the change in NSW. | Across NSW, 4% of Indigenous people were of retirement age, with the number up by 49% since 2006, and up by 118% since 2001. | |||||||||||||
| There are seven life stages: infants (aged 04); primary school (511); high school (1217); young adults (1824); adults (2544); mature adults (4564); and older people (65+). | ||||||||||||||
| Age profile | ||||||||||||||
| Australia's Indigenous population has an age profile that is significantly younger than Australia's non-Indigenous population, with a much lower median age (21 vs 38 years). A much higher proportion of Indigenous people were children, and a much smaller proportion were 65 or older. | ||||||||||||||
| In Australia's Indigenous population in 2011 ... | More details | |||||||||||||
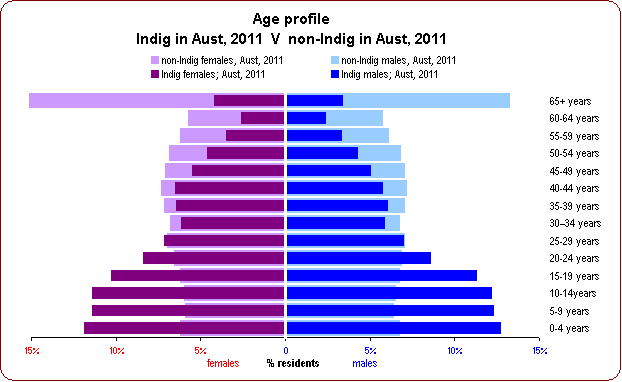
| z | The average age was 26 years in 2011, with half the population aged under 21 years (the median age). | The average age was 13 years younger than for Australia's non-Indigenous residents, and the median age was 17 years younger. | ||||||||||||
| The largest age groups were 04 years (12% of residents), 59 years (12%) and 1014 years (12%). | For non-Indigenous residents of Australia, the largest were 65+ years (14% of residents), 4044 years (7%) and 3539 years (7%). | |||||||||||||
| z | Since 2006, the average age had changed little; since 2001, it had risen by 2 years. | The average age of Indigenous people in NSW had risen by 2 years since 2006, and had risen by 3 years since 2001. | ||||||||||||
| The age groups that increased most in number from 2006 were 6064 years (51% more), 5559 years (41% more) and 65+ years (37% more). | In the NSW Indigenous population, the age groups that increased most from 2006 were 6064 years, 65+ years and 5559 years. | |||||||||||||
| z | Only 20,772 or 3.8% of Indigenous residents were aged 65+ years, compared with 14% of Australia's non-Indigenous residents. | While the number aged 65+ was 37% larger than in 2006, the proportion this age was little changed since 2006, when it was 3.3%. | ||||||||||||
| z | There were noticeably more males than females among Indigenous residents aged 1519 years, 59 years and 04 years. | There were noticeably more women than men among those aged 65+ years, 4044 years and 6064 years. | ||||||||||||
 |
||||||||||||||
| The age profile of a community can be drawn like a tree. The length of each branch is proportional to the number of people in an age group. The right side of the tree represents males (blue), the left side, females (purple). Higher branches represent older people. In this Age Tree, the dark branches show the Indigenous residents of Australia in 2011, compared with non-Indig, 2011, shown by the lighter, background branches. | ||||||||||||||
| Population Features | ||||||||||||||
| The elder difference | Indicator: % aged 65+ in population | |||||||||||||
| Commonly, Indigenous communities have a lower proportion of people aged over 65, due in part to shorter average life-span. This is an indication of poverty and ill-health. Having fewer elders has many effects on the community and its development. | ||||||||||||||
| z | In 2011, 4% of Australia's Indigenous residents were aged 65+, compared with 14% of non-Indigenous residents in Australia. The elder difference was 10%. | 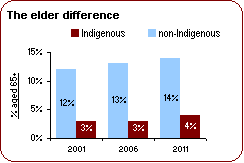 |
||||||||||||
| z | The elder difference had changed little since 2006, after having widened by 1% over the previous 5 years. | |||||||||||||
| z | The elder difference in NSW was 11% and had widened by 1% since 2006. It had changed little over 2001 to 2006. | |||||||||||||
| The infant difference | Indicator: % aged under 5 in population | |||||||||||||
| Indigenous communities generally have a higher proportion of young people due to larger families and fewer older people. Very high proportions of infants in the population can be an indication of poverty, and the need for maternal and child support services. | ||||||||||||||
| z | In 2011, 12% of Australia's Indigenous residents were infants under 5, compared with 6% of non-Indigenous residents in Australia. The infant difference was 6%. | 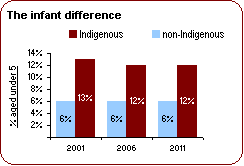 |
||||||||||||
| z | The infant difference had changed little since 2006, after having closed by 1% over the previous 5 years. | |||||||||||||
| z | The infant difference in NSW was 6% and had changed little since 2006. It had closed by 1% over 2001 to 2006. | |||||||||||||
| The dependency difference | Indicator: ratio of dependent age to working age | |||||||||||||
| The dependency ratio measures the number of working-age adults per person of dependent age (under 15 or 65+). A higher dependency ratio means, on average, each person of working-age has more dependents to support. Nationally, the dependency ratio is 2.0 adults per dependent. | ||||||||||||||
| z | In 2011, the dependency ratio of Australia's Indigenous community was 1.5 working-age adults per dependent, compared with 2.0 for non-Indigenous families in Australia. The dependency ratios were 25% different. | 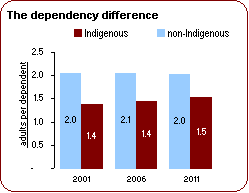 |
||||||||||||
| z | The dependency difference had closed by 5% since 2006, after having closed by 2% over the previous 5 years. | |||||||||||||
| z | The dependency difference in NSW was 25% and had closed by 6% since 2006. It had closed by 3% over 2001 to 2006. | |||||||||||||
| Generations | ||||||||||||||
| A generation is all the people born in the same 15-year period. The number in a generation can increase only if more people that age move into their area. However, the number of Indigenous people in a generation can also increase if more say they have Indigenous origins, in the Census. | ||||||||||||||
| In Australia's Indigenous population in 2011 ... | ||||||||||||||
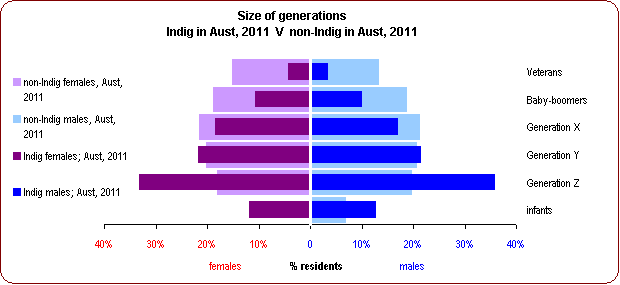
| z | 4% were of the Veteran generation, born before 1946 and aged 65 or over in 2011. | |||||||||||||
| This was 10% lower than for non-Indigenous residents of Australia. | The number of Veterans had fallen by 14% since 2006, probably due to deaths, and had fallen by 25% since 2001. | The number of Indigenous Veterans in NSW had fallen by 7% since 2006, and by 14% since 2001. | ||||||||||||
| z | 10% were Baby-Boomers, born 1946 to 1961 and aged 5064 in 2011. | |||||||||||||
| This was 8% lower than for non-Indigenous. | The number of Baby-Boomers had increased by 5% since 2006, and by 2% since 2001. This suggests more moved in or responded as Indigenous in the 2011 Census. | The number of Indigenous Baby-Boomers in NSW had increased by 12% since 2006, and by 14% since 2001. | ||||||||||||
| z | 18% were Generation X, born between 1961 and 1976, and aged 3549 in 2011. | |||||||||||||
| This was 4% fewer than for non-Indigenous. | The number in Gen X had increased by 8% since 2006, but had increased by 6% since 2001. This suggests many more moving in or identifying Indigenous origins. | In NSW, the number of Indigenous Gen Xs had increased by 14% since 2006, and by 17% since 2001. | ||||||||||||
| z | 22% were Generation Y, born 1976 to 1991 and aged 2034 in 2011. | |||||||||||||
| This was 1% larger than for non-Indigenous. | The number in Gen Y had increased by 1% since 2006, but had fallen by 7% since 2001. This suggests some more identifying Indigenous origins. | Across NSW, the size of the Indigenous Gen Y had increased by 1% since 2006, but had fallen by 5% since 2001. | ||||||||||||
| z | 34% were Generation Z, born from 1991 to 2006, and aged 519 in 2011. | |||||||||||||
| This was 16% larger than for non-Indigenous. | The number of Gen Z children had increased by 10% since 2006 suggesting more moving in or being identified as Indigenous. | Across NSW, the size of the Indigenous Gen Z had increased by 14% since 2006. | ||||||||||||
| z | 12% were infants, aged under 5 in 2011. None had been born in 2006. | |||||||||||||
| The proportion of infants was 6% more than for non-Indigenous residents of Australia. | ||||||||||||||
 |
||||||||||||||
| Households types & sizes | ||||||||||||||
| In 2011, the 548,370 Indigenous residents of Australia were living in 209,050 households, which was one-quarter more than in 2006. | ||||||||||||||
| The main types of Indigenous households in Australia in 2011 were: | ||||||||||||||
| z | Three-tenths were couples with children (65,019 households, or 31%). | similar to non-Indig in Aust | ||||||||||||
| z | One-quarter were one-parent families (56,246 households, or 27%). | 17% higher than non-Indig | ||||||||||||
| z | One-seventh were couples without children (31,339 households, or 15%). | 12% lower than non-Indig | ||||||||||||
| z | One-seventh were one-person households (29,534 households, or 14%). | 10% lower than non-Indig | ||||||||||||
| z | There were about 11,600 multi-family households, and 4,421 other types of households. | |||||||||||||
|
||||||||||||||
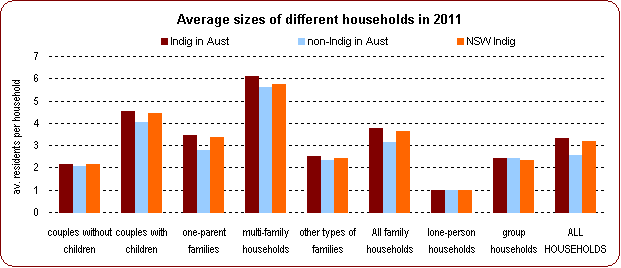
| Indigenous households had an average of 3.3 residents in 2011, which was little changed since 2006, and down by 0.3 from 2001. | ||||||||||||||
| z | The average size of Indigenous households in NSW was 3.2 residents, so Australia's households were 4% larger on average. | The average size of the NSW Indigenous households was little changed since 2006. | ||||||||||||
| z | The average size of households in Australia without Indigenous members was 2.6 residents; Indigenous households were 29% larger. | The average size of non-Indigenous households in Australia changed little from 2006. | ||||||||||||
| z | The larger size of Indigenous households is partly a result of fewer Indigenous people living alone. | 14% of the Indigenous households were lone persons; 25% of others. | ||||||||||||
| z | Indigenous couple families averaged 2.5 children, compared with 2.4 among the NSW Indigenous and 2.0 among Australia's non-Indigenous families. | The average number of children in nuclear families here was little changed since 2006, and little different from 2001. | ||||||||||||
| z | Indigenous one-parent families here averaged 2.4 children, compared with 2.4 for the NSW Indigenous and 1.8 for Australia's non-Indigenous one-parent families. | The average children per one-parent families was little changed since 2006, and up by 0.1 since 2001. | ||||||||||||
| z | At an average size of 3.3 persons, the 209,050 Indigenous households would have had around 692,723 members, so seem to include 199,141 people who did say they had Indigenous origins in the Census. | This suggests that almost three in every ten members of Indigenous households did not say they had Indigenous origins in the Census. | ||||||||||||
| Household Features | ||||||||||||||
| The single parent difference | Indicator: % of families with children having one parent | |||||||||||||
| Single parent families often have low incomes because it is difficult for the parent to work without adequate child care and support. High proportions of one-parent families can indicate a high need for support and opportunities. | ||||||||||||||
| z | In 2011, 46% of Australia's Indigenous families with children had one parent, compared with 24% of non-Indigenous families in Australia. The single parent difference was 22%. | 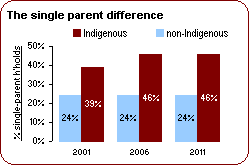 |
||||||||||||
| z | The single parent difference had changed little since 2006, after having widened by 7% over the previous 5 years. | |||||||||||||
| z | The single parent difference in NSW was 25%. It had changed little since 2006 after having widened by 8% over 2001 to 2006. | |||||||||||||
| The lone person difference | Indicator: % of households with one person | |||||||||||||
| Living alone is about half as common for Indigenous people as for others, so most communities have a large lone person difference. The difference is influenced locally by the availability of small dwellings. | ||||||||||||||
| z | In 2011, 14% of Australia's Indigenous households were lone persons, compared with 25% of non-Indigenous households in Australia. The lone person difference was 11%. Living alone was four-sevenths as common for Indigenous people. | 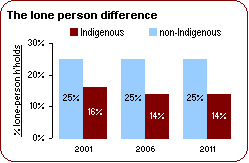 |
||||||||||||
| z | The lone person difference had changed little since 2006, after having widened by 2% over the previous 5 years. | |||||||||||||
| z | The lone person difference in NSW was 10% and had changed little since 2006. It had widened by 2% over 2001 to 2006. | |||||||||||||
| The family size difference | Indicator: average size of couple families with children | |||||||||||||
 The
family size difference is the gap between the average sizes of Indigenous and
non-Indigenous 'nuclear families' (couple with children). Larger families
have to spread their income among more members, so living standards tend to
be lower. The
family size difference is the gap between the average sizes of Indigenous and
non-Indigenous 'nuclear families' (couple with children). Larger families
have to spread their income among more members, so living standards tend to
be lower. |
||||||||||||||
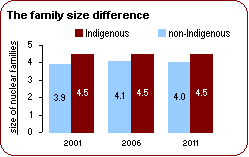
| z | In 2011, the average size of Australia's Indigenous nuclear families was 4.5 persons, compared with 4.0 for non-Indigenous families in Australia, a family size difference of 13%. | |||||||||||||
| z | The family size difference had widened by 3% since 2006, after having closed by 5% over the previous 5 years. | |||||||||||||
| z | The family size difference in NSW was 7% and had widened by 2% since 2006. It had closed by 5% over 2001 to 2006. | |||||||||||||
| Types of housing | ||||||||||||||
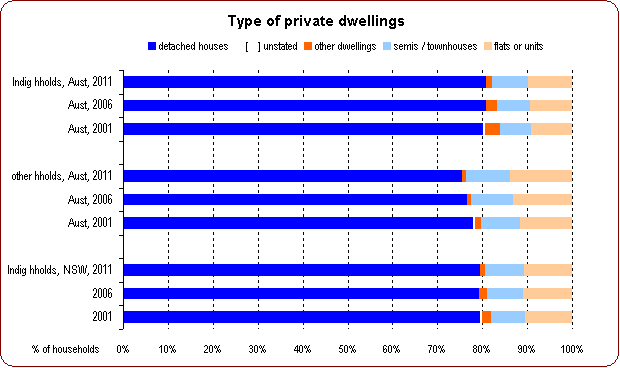
| Most Indigenous households in Australia lived in detached houses (81%), with 10% living in flats or units and 8% living in semis / townhouses. | ||||||||||||||
| z | Indigenous households in Australia lived in different types of dwellings to non-Indigenous residents of Australia, with 5% more Indigenous households in detached houses. | The proportion in flats or units was 4% lower than for non-Indigenous residents. The proportion in semis / townhouses was 2% lower. | ||||||||||||
| z | The proportion of Indigenous households living in detached houses was little changed since 2006 and up by 1% since 2001. | The proportion of non-Indigenous households in detached houses was down by 1% since 2006 and down by 2% since 2001. | ||||||||||||
|
||||||||||||||
| 16,353 Indigenous people in Australia (3%) were staying in institutional accommodation (e.g. nursing homes, boarding houses, correctional centres, hospitals, barracks or boarding schools) on Census night, 2011. | ||||||||||||||
| z | The type of people living in institutional housing in smaller communities depends on the types of institutions. There may be none. | Overall, there were 381,812 people in institutional accommodation in Australia. | ||||||||||||
| z | There were 19,941 Indigenous people living in institutional accommodation in 2006, and 16,135 in 2001. | 2% of Australia's non-Indigenous population lived in institutions in 2011 (4% in 2006). | ||||||||||||
| Of the Indigenous people in institutional accommodation, 11,978 were male and 4,377 were female, a gender ratio of 2.7 males per female. | ||||||||||||||
| 1,130 Indigenous people were living in improvised accommodation (e.g. shacks, tents or sleeping out), in Australia on Census night. | ||||||||||||||
| z | This number was down by 1,498 since 2006. | There were 6,270 non-Indigenous people in improvised accommodation in Australia. | ||||||||||||
| There were 615 males and 513 females. | ||||||||||||||
| Housing tenure | ||||||||||||||
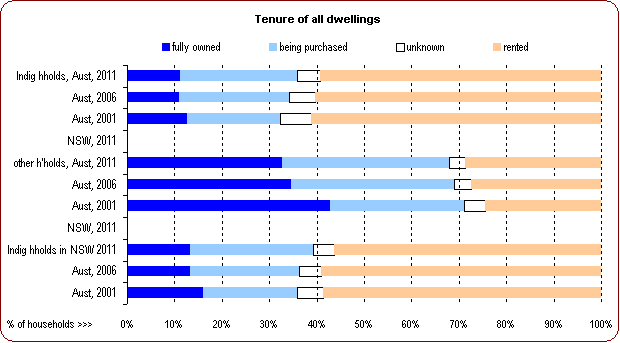
| In 2011, Indigenous households in Australia most commonly lived in dwellings that were rented (59% of the households). Another 25% lived in dwellings that were being purchased, and 11% in ones that were fully owned. | ||||||||||||||
| z | The proportion living in dwellings that were rented was 31% higher than for non-Indigenous households in Australia. | The proportion of Indigenous households in rented dwellings in Australia was 3% higher than in NSW. | ||||||||||||
| Since 2006, the proportion living in rented dwellings was unchanged; it was 2% lower than in 2001. | Across NSW, the proportion of Indigenous households in rented dwellings was down by 3% since 2006, and down by 2% since 2001. | |||||||||||||
| z | The proportion in dwellings that were being purchased was 10% lower than for non-Indigenous households in Australia. | The proportion of Indigenous households in mortgaged dwellings locally was 1% lower than in NSW. | ||||||||||||
| The proportion of Indigenous households in mortgaged dwellings was up by 2% since 2006 and up by 5% since 2001. | The proportion of the NSW Indigenous households in mortgaged dwellings was up by 3% since 2006 and up by 6% since 2001. | |||||||||||||
| z | 23,331 Indigenous dwellings were fully owned. The proportion (11%) was 21% less than for non-Indigenous households in Australia. | The proportion of Indigenous households in fully-owned dwellings in Australia was 2% less than in NSW. | ||||||||||||
| The proportion in fully-owned dwellings was steady since 2006 and down by 2% since 2001. | The proportion of the NSW Indigenous households in fully-owned dwellings was unchanged since 2006 and down by 3% from 2001. | |||||||||||||
|
||||||||||||||
| Of 124,097 Indigenous rental households, 36% were managed by public housing and 35% were managed by real estate agents. | ||||||||||||||
| z | 45,011 Indigenous households lived in public housing (22% of households). | 4% of the non-Indigenous households in Australia lived in public housing. | ||||||||||||
| The number of Indigenous households in public housing had risen by 11,607 since 2006. | The number of non-Indigenous households in public housing in Australia fell by 1,346 since 2006. | |||||||||||||
| Housing Gap Indicators | ||||||||||||||
| The home ownership gap | Indicator: % of households owning/buying their home | |||||||||||||
| Ownership of a home is a principal way that Australians accumulate wealth and ensure secure accommodation. A significantly lower level of home ownership is generally a strong indicator of disadvantage. | ||||||||||||||
| z | In 2011, 36% of Australia's Indigenous households were either buying or owning their home, compared with 68% of non-Indigenous households in Australia, a home ownership gap of 32%. | 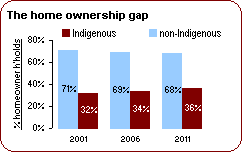 |
||||||||||||
| z | The ownership gap had closed by 3% since 2006, after having closed by 4% over the previous 5 years. | |||||||||||||
| z | The ownership gap in NSW was 28% and had closed by 3% since 2006. It had closed by 2% over 2001 to 2006. | |||||||||||||
| The 'unhoused' gap | Indicator: rate /'000 of people in improvised housing | |||||||||||||
 An
indicator of homelessness in the Census is the count of people living in
improvised housing (eg shacks, tents or sleeping out). High proportions of
residents without proper housing generally indicates poverty or a transient
population. An
indicator of homelessness in the Census is the count of people living in
improvised housing (eg shacks, tents or sleeping out). High proportions of
residents without proper housing generally indicates poverty or a transient
population. |
||||||||||||||
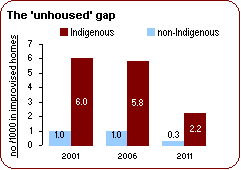
| z | In 2011, 2.2 in every thousand Indigenous residents in Australia lived in improvised housing, when 0.3 per 1000 of non-Indigenous residents did. The unhoused gap was 1.9 per 1000. | |||||||||||||
| z | The unhoused gap had closed by 2.9 per 1000 residents since 2006, after having closed by 0.2 per 1000 over the previous 5 years. | |||||||||||||
| z | The unhoused gap in NSW was 0.2 per 1000, and had closed by 1.1 per 1000 since 2006. It had widened by 0.1 per 1000 over 2001 to 2006. | |||||||||||||
| This category includes sheds, tents, humpies and other improvised dwellings, occupied on Census Night. It also includes people sleeping on park benches or in other 'rough' accommodation (the traditional definition of homeless people). The unhoused rate fell by two-thirds nationally for Indigenous and non-Indigenous people between 2006 and 2011. | ||||||||||||||
| The institutional gap | Indicator: rate /'000 of residents in non-private dwellings | |||||||||||||
| The proportion of people in institutional accommodation can indicate that a community has a particular character, but local knowledge is needed to identify the nature of these institutions. They include hotels, boarding houses, nursing homes, correctional centres, barracks and hospitals. | ||||||||||||||
| z | In 2011, 32 in every 1000 Indigenous residents in Australia were in institutional housing, but 17 per 1000 non-Indigenous residents of Australia were. The institutional gap was 15 (per 1000). | 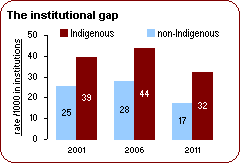 |
||||||||||||
| z | The institutional gap had changed little since 2006, after having widened by 2 per 1000 over the previous 5 years. | |||||||||||||
| z | The institutional gap in NSW was 9 per 1000 and had changed little since 2006. It had widened by 3 per 1000 over 2001 to 2006. | |||||||||||||
| Individual incomes | ||||||||||||||
| In 2011, the average income of Australia's Indigenous adults (aged 15+) was about $524 a week, which was very close to Indigenous adults in NSW ($530), but 35% less than the average of all adults in Australia ($801). | ||||||||||||||
| z | Indigenous men in Australia averaged $570 a week (58% of the overall male average). Women averaged $484 a week (76% of the overall female average). | 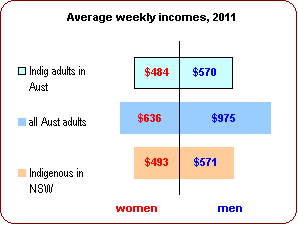 |
||||||||||||
| z | The average weekly income of Indigenous men in Australia was almost the same as in NSW. Among Indigenous women, the average income in Australia was close to the average in NSW. | |||||||||||||
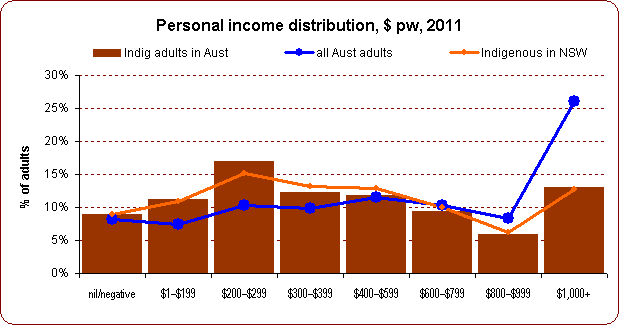
| z | Half the Indigenous adults received less than $362 a week, the median income. | |||||||||||||
| The income distribution pattern among Indigenous adults in Australia was similar to that of the Indigenous households of NSW, but very different from all adults in Australia. | ||||||||||||||
| Compared with Indigenous adults across NSW, | z | more local Indigenous adults were in the $200$299 income range. | ||||||||||||
| z | fewer local Indigenous adults were in the $400$599 or $300$399 income range. | |||||||||||||
| Compared with all adults in Australia, | z | more local Indigenous adults were in the $200$299 or $1$199 income range. | ||||||||||||
| z | fewer local Indigenous adults were in the $1,000+ or $800$999 income range. | |||||||||||||
 |
||||||||||||||
| Household incomes | ||||||||||||||
| In 2011, the average income of Australia's Indigenous households was about $1,287 a week. However, household income is a poor indicator of well-being for Indigenous people because their households generally have more members to support. | ||||||||||||||
| z | The average Indigenous household income here was very close to average for Indigenous households in NSW, $1,242 a week; | 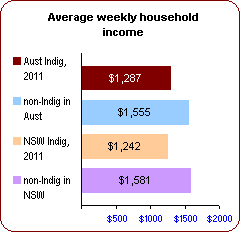 |
||||||||||||
| z | but 17% less than the average of Australia's non-Indigenous households, $1,555 a week. | |||||||||||||
| z | Half the Indigenous households received less than $991 a week (their median household income). | |||||||||||||
| z | Indigenous households in Australia had an average size of 3.3 residents, compared with 2.6 for Australia's non-Indigenous households. Household incomes thus had to be spread among more people than in non-Indigenous households. | |||||||||||||
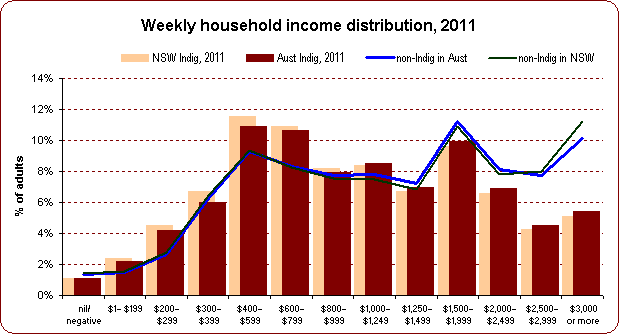
| The income distribution pattern among Indigenous households in Australia was similar to that across NSW, but somewhat different from that of all households in Australia. | ||||||||||||||
| Compared with Indigenous households across NSW, | z | income distribution was onlt marginally different. | ||||||||||||
| z | fewer local Indigenous households were in the $300 $399 or $400 $599 income range. | |||||||||||||
| Compared with non-Indigenous households in Australia, | z | more local Indigenous households were in the $600 $799 and $400 $599 income ranges. | ||||||||||||
| z | fewer local Indigenous households were in the $3,000 or more and $2,500 $2,999 income ranges. | |||||||||||||
 |
||||||||||||||
| Income Gap Indicators | ||||||||||||||
| The personal income gap | Indicator: median weekly income of adults (15+) | |||||||||||||
| Income is a vital contributor to well-being. One indicator of disadvantage is a low median income; the amount which half the people earn less than. | ||||||||||||||
| z | In 2011, the median income of Indigenous adults in Australia ($362) was 62% that of all adults in Australia ($582); the personal income gap was 38%. | 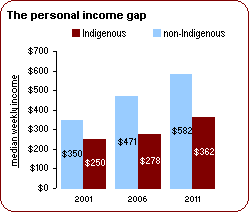 |
||||||||||||
| z | The personal income gap had closed by 3% since 2006, after having apparently widened over the previous 5 years. | |||||||||||||
| z | The personal income gap in NSW was 34% and had narrowed by 2% since 2006. It seems to have widened significantly over 2001 to 2006. | |||||||||||||
| Note that 2001 medians are given as ranges (eg $700-799), so comparisons with later years are not accurate. | ||||||||||||||
| The household income gap | Indicator: median income of households | |||||||||||||
| Another indicator of disadvantage is a low median household income; half of all households receive less than this amount. However, indigenous households tend to be larger, with more dependents, so household income does not reflect disadvantage as well as individual income. | ||||||||||||||
| z | In 2011, the median income of Indigenous households in Australia was $991; the median income of non-Indigenous households in Australia was $1,241; the income gap was 20%. | 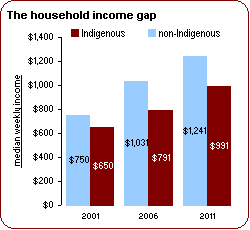 |
||||||||||||
| z | The household income gap had closed by 3% since 2006, after having widened over the previous 5 years. | |||||||||||||
| z | The household income gap in NSW was 25% and had closed by 6% since 2006. It had widened over 2001 to 2006. | |||||||||||||
| Note that 2001 medians are given as ranges (eg $700-799), so comparisons with later years are not accurate. | ||||||||||||||
| Current education | ||||||||||||||
| Having high proportions of people in education is a good indicator of positive individual and community development. In Australia, three in every ten Indigenous residents (173,516 people) were attending an educational institution in 2011. | ||||||||||||||
| Indigenous participation varied with age: | 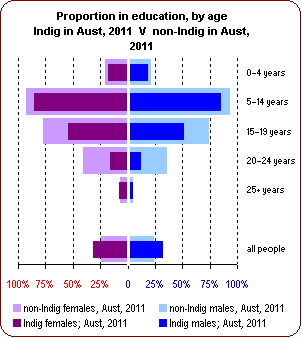 |
|||||||||||||
| z | 85% of 514 yearolds | |||||||||||||
| z | 52% of 1519 yearolds | |||||||||||||
| z | 18% of 04 yearolds | |||||||||||||
| z | 14% of 2024 yearolds | |||||||||||||
| z | 6% of 25+ year-olds | |||||||||||||
| Because the Indigenous population has much higher proportions of school age, their overall participation rate in education, 32%, is higher than the non-Indigenous people of Australia at 24%. However, there were ... | ||||||||||||||
| z | 24% fewer Indigenous 2024 yearolds in education, compared to others that age. | |||||||||||||
| z | 23% fewer Indigenous 1519 yearolds in education. | |||||||||||||
| z | 8% fewer Indigenous 514 yearolds in education. | |||||||||||||
| Locally, there were 105 females per 100 males attending education, varying with age from 211 females per 100 males among 25+ year-olds to 104 males per 100 females among 514 yearolds. | ||||||||||||||
| Of the local Indigenous people in education, the largest number were in primary school (81,554) and high school (50,985), then pre-school (13,975). There were 13,211 in TAFE and 10,127 in Uni / tertiary. | ||||||||||||||
| z | The number of Indigenous pre-schoolers was up by 23% since 2006 and up by 34% since 2001. | 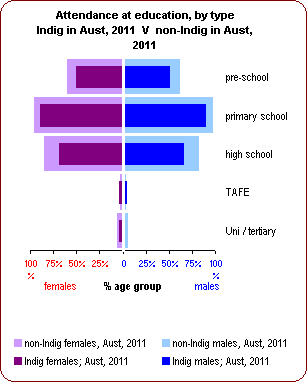 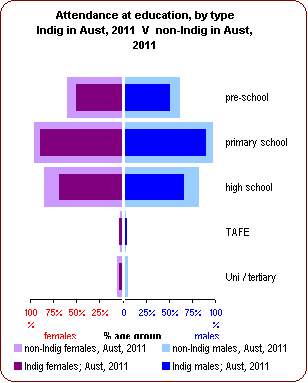 |
||||||||||||
| Indigenous pre-school students were 50% of the population aged 45. This rate was 13% lower than that found in NSW and 11% lower than for non-Indigenous infants in Australia. | ||||||||||||||
| z | The number of Indigenous primary students was 14% more than in 2006 and 14% more than in 2001. | |||||||||||||
| Indigenous primary students were 90% of the number aged 511. This rate was 1% higher than the Indigenous rate in NSW and 7% lower than for non-Indigenous children across Australia. | ||||||||||||||
| z | The number of Indigenous secondary students was up by 29% since 2006 and up by 47% since 2001. | |||||||||||||
| Indigenous secondary students were 67% of the number aged 1217. This rate was 16% lower than the rate for Australia's non-Indigenous teenagers; it was 7% lower than for the NSW Indigenous teenagers. | ||||||||||||||
| Schooling levels | ||||||||||||||
| In 2011, Indigenous adults in Australia had completed an average of 10 years of school, compared with 10 years 10 months for non-Indigenous adults in Australia. In NSW, Indigenous adults averaged 10 years schooling. | ||||||||||||||
| z | 81,556 Indigenous adults had completed Year 12, which was 48% more than in 2006 and 95% more than in 2001. | 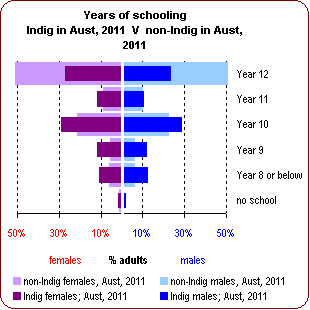 |
||||||||||||
| The proportion of local Indigenous adults who had completed Year 12 (25%), was 27% lower than non-Indigenous adults in Australia. | ||||||||||||||
| In NSW, 24% of Indigenous people had completed Year 12. | ||||||||||||||
| z | 65% of Indigenous adults here had completed at least Year 10, which was similar to Indigenous adults in NSW. | |||||||||||||
| z | 42,146 Indigenous adults (13%) had completed less than 9 years of school. This indicates the country may have literacy problems. | |||||||||||||
| The average schooling level of Australia's Indigenous adults had risen by 4 months since 2006, and risen by 7 months since 2001. | ||||||||||||||
| The main influences since 2006 were a 48% increase in the number who had finished Year 12 and a 8% decrease in the number who had finished Year 8 or below. | ||||||||||||||
| The average schooling of local Indigenous adults: | 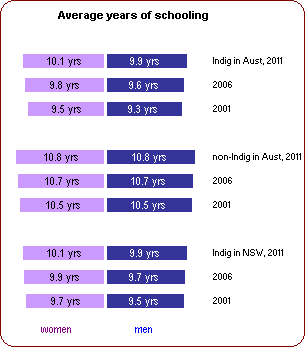
|
|||||||||||||
| z | for men, had risen by 4 months since 2006, and risen by 7 months since 2001. | |||||||||||||
| z | for women had risen by 4 months since 2006, and risen by 7 months since 2001. | |||||||||||||
| For non-Indigenous adults in Australia, average schooling: | ||||||||||||||
| z | for men, had risen by 2 months since 2006 and risen by 4 months since 2001. | |||||||||||||
| z | for women, had risen by 2 months since 2006 and risen by 5 months since 2001. | |||||||||||||
| The average schooling of Indigenous adults in NSW: | ||||||||||||||
| z | for men, had risen by 3 months since 2006, and risen by 5 months since 2001. | |||||||||||||
| z | for women had risen by 2 months since 2006, and risen by 5 months since 2001. | |||||||||||||
| Internet connections | ||||||||||||||
| In 2011, 63% of Australia's Indigenous households had an Internet connection but 31% or 65,668 households had no connection (6% did not say). | ||||||||||||||
| z | The proportion of Indigenous households with Internet here was 3% lower than that in NSW (66%), | 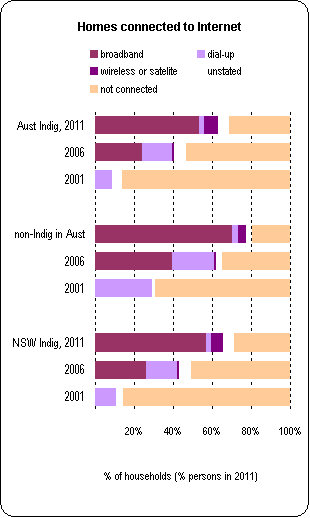 |
||||||||||||
| and 14% lower than non-Indigenous households in Australia (with 77% connected). | ||||||||||||||
| z | The proportion of Indigenous households with Internet was up by 22% since 2006. | |||||||||||||
| The proportion was up by 23% among Indigenous households in NSW. | ||||||||||||||
| It was up by 15% for non-Indigenous households in Australia (it was already 62% in 2006). | ||||||||||||||
| In 2001, 9% of Australia's Indigenous people used the internet at home, as did 11% of the NSW Indigenous people. Then, 29% of non-Indigenous people in Australia used the internet at home. | ||||||||||||||
| z | 53% of Australia's Indigenous households had a broadband connection while 3% had a slower dial-up connection. | |||||||||||||
| 70% of non-Indigenous households in Australia and 57% of Indigenous households in NSW had broadband. | ||||||||||||||
| z | The proportion of Indigenous households in Australia with broadband was up by 29% since 2006. | |||||||||||||
| It was up by 31% among non-Indigenous households in Australia and up by 31% for Indigenous households in NSW. | ||||||||||||||
| Education Gap Indicators | ||||||||||||||
| The pre-school gap | Indicator: % of infants under 5 in education | |||||||||||||
| Early childhood education is an important contributor to success in school and later education, as well as making paid work more feasible for carers. A useful Census indicator is the proportion of infants in education (ie pre-school). Across Australia, pre-school rates for Indigenous and other infants were not that different: 20% to 18%. | ||||||||||||||
| z | In 2011, 18% of Australia Indigenous infants were in education, compared with 20% of all infants in Australia. The pre-school gap was 2%. | 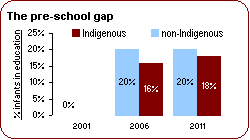 |
||||||||||||
| z | The pre-school gap had closed by 2% since 2006 (there is no 2001 data). | |||||||||||||
| z | The pre-school gap in NSW was 1% and had narrowed by 3% since 2006. | |||||||||||||
| The teenage education gap | Indicator: % of 1519 year-olds in education | |||||||||||||
| Education of older teenagers is vital for their employment future, so low levels of participation in education indicates disadvantage. An important Census educational indicator is the proportion of 1519 year-olds in education. | ||||||||||||||
| z | In 2011, 52% of Australia Indigenous teenagers aged 1519 were in education, when 75% of other teenagers in Australia were. The teenage education gap was 23%. | 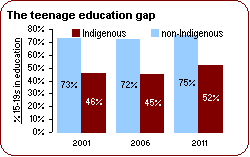 |
||||||||||||
| z | The teenage education gap had closed by 4% since 2006, after changing little from 2001 to 2006. | |||||||||||||
| z | The teenage education gap in NSW was 19% and had narrowed by 6% since 2006. It widened by 3% over 2001 to 2006. | |||||||||||||
| The schooling gap | Indicator: % of 5-14 year olds in education | |||||||||||||
| School is compulsory for children under 15, so the proportion of children aged 514 at school should be around 93%, allowing for some not having started school, and some unable to attend. Low schooling rates suggests truancy or underage school leavers. | ||||||||||||||
| z | In 2011, 85% of Australia Indigenous children aged 514 were in education, when 93% of other teenagers in Australia were. The schooling gap was 8%. | 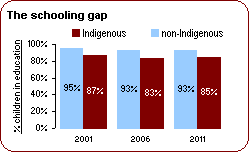 |
||||||||||||
| z | The schooling gap had closed by 2% since 2006 after widening by 2% from 2001 to 2006. | |||||||||||||
| z | The schooling gap in NSW was 7% and had widened by 1% since 2006. It widened by 1% over 2001 to 2006. | |||||||||||||
| Education Gap Indicators | ||||||||||||||
| The Year 12 gap | Indicator: % of adults 15+ completed 12 years school | |||||||||||||
| The proportion of adults who have finished 12 years of school is an important indicator of a community's educational resources. Half of all Australian adults have finished 12 years of school. Lower rates indicate a disadvantaged community. | ||||||||||||||
| z | In 2011, 25% of Australia Indigenous adults had complete 12 years of school, compared with 52% of non-Indigenous adults in Australia. The Year 12 gap was 27%. | 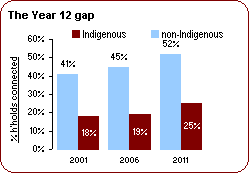 |
||||||||||||
| z | The Year 12 gap had changed little since 2006 after widening by 3% from 2001 to 2006. | |||||||||||||
| z | The Year 12 gap in NSW was 28% and had widened by 2% since 2006. It widened by 2% over 2001 to 2006. | |||||||||||||
| The schooling years gap | Indicator: average number of years school of adults | |||||||||||||
| The average years schooling of adults is an indicator of a community's educational resources. Nationally, the average has been creeping up to 10 years 10 months. A local average under 10½ years shows disadvantage. | ||||||||||||||
| z | In 2011, Australia Indigenous adults had completed an average of 10 years of school, compared with 10 years 10 months for non-Indigenous adults in Australia. The schooling years gap was 10 months. |  |
||||||||||||
| z | The schooling years gap had closed by 2 months since 2006, after barely changing over the previous five years. | |||||||||||||
| z | The schooling years gap in NSW was 10 months and had changed little since 2006. It changed little over 2001 to 2006. | |||||||||||||
| The Internet gap | Indicator: % of households with an Internet connection | |||||||||||||
| The Internet is becoming increasingly important as a source of communication and information, and is becoming an essential service. A lower level of internet connections indicates 'digital disadvantage'. | ||||||||||||||
| z | In 2011, 63% of Australia's Indigenous households had an Internet connection, compared with 77% of non-Indigenous households in Australia, an Internet gap of 14%. | 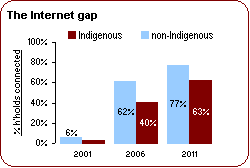 |
||||||||||||
| z | The Internet gap had closed by 7% since 2006, after having widened by 18% over the previous 5 years. | |||||||||||||
| z | The Internet gap in NSW was 11% and had narrowed by 8% since 2006. It widened by 15% over 2001 to 2006. | |||||||||||||
| Disability Levels | ||||||||||||||
| In 2011 in Australia, 29,559 Indigenous residents reported having a severe and chronic disability, 5.4% of the population. Among all Australia's residents, 4.6% similarly reported a disability. | ||||||||||||||
| People with a profound or severe disability are defined as those people needing help or assistance with either self-care, mobility or communication, because of a disability, long term health condition or old age. | ||||||||||||||
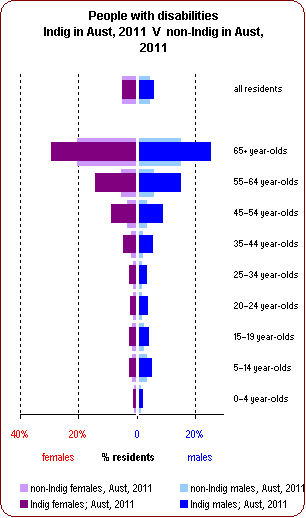
| z | Disability rates tend to rise with age, here peaking at 27% of Indigenous 65+ year-olds and 15% of 5564 year-olds . |
|
||||||||||||
| Among younger Indigenous residents, disability rates were highest among 514 year-olds at 4% and 1519 year-olds at 3%. | ||||||||||||||
| Because Indigenous populations generally have far fewer aged people, when disability rates are high, and many more children, with low disability rates, compared with non-Indigenous populations, their average disability rate can be lower, despite being higher among most age group. | ||||||||||||||
| z | Here, the overall Indigenous disability rate was 16% higher than the overall rate among Australia's non-Indigenous people, 5.4% to 4.6%. However ... | |||||||||||||
| among 4554 year-olds, the Indigenous disability rate was 2.7 times that of all residents (8.8% to 3.2%); | ||||||||||||||
| among 5564 year-olds, the Indigenous disability rate was 2.7 times that of all residents (14.6% to 5.4%). | ||||||||||||||
| z | Indigenous disability rates were higher for men than women, 5.7% to 5.1%. | |||||||||||||
| Females with disabilities outnumbered males by 1.5 females per male among 65+ year-olds. | ||||||||||||||
| Men with disabilities outnumbered women by 2.0 males per female among 514 year-olds. | ||||||||||||||
| From 2006 to 2011, overall disability rates among Indigenous residents rose from 4.3% to 5.4%, an increase of 25% in the disability rate. | ||||||||||||||
| z | Among the NSW Indigenous people, disability rates rose by 25%. | 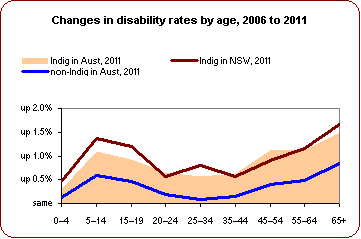 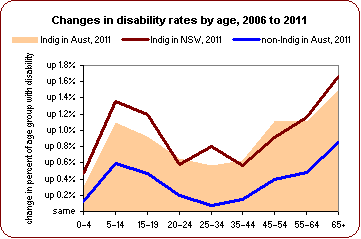 |
||||||||||||
| Among all Australia residents, disability rates rose by 12%. | ||||||||||||||
| z | Local Indigenous disability rates increased most among those aged 65+, from 26% in 2006 to 27% in 2011. | |||||||||||||
| Local rates also rose among 5564 year-olds and 4554 year-olds. | ||||||||||||||
| Local rates rose least among those aged 04 year-olds and 2534. | ||||||||||||||
| Disability care given | ||||||||||||||
| In the 2011 Census, 45,328 Indigenous adults in Australia, 13% of the adult population, reported that they gave assistance to a person with a severe or profound disability. There were at that time 29,559 Indigenous residents who reported a severe or profound disability. | ||||||||||||||
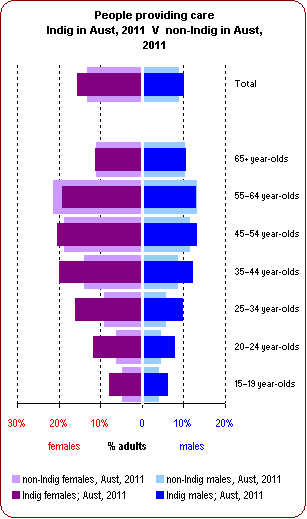
| z | Across the age groups, the proportion of Indigenous people caring for another with a disability ranged from 17% of 4554 year-olds and 16% of 3544 year-olds to 7% of 1519 year-olds. |
|
||||||||||||
| z | Women are more often carers than men. In Australia's Indigenous community, there were 1.7 women per man among those caring for a person with a disability. | |||||||||||||
| Female carers were most common among 3544 year-olds with 1.8 females per male caring, and 2534 year-olds with 1.8 females per male caring. | ||||||||||||||
| Male carers were most common in no age groups. | ||||||||||||||
| z | The 13% carer rate among Indigenous residents was higher than the average for all adults in Australia, 11%. | |||||||||||||
| Among 2024 year-olds, the proportion of Indigenous carers was 1.8 times the average. | ||||||||||||||
| Among 2534 year-olds, Indigenous carers were also 1.8 times more common. | ||||||||||||||
| z | In NSW, 14% of Indigenous adults were caring for a person with a disability. | |||||||||||||
| While similar proportions of local 1519 year-olds were carers, compared with the NSW Indigenous community, 11% fewer aged 4554 were. | ||||||||||||||
| Since 2006, overall caring rates among Indigenous adults have risen from 11% to 13%. | ||||||||||||||
| z | Among the NSW Indigenous adults, caring rates rose by 1%. | 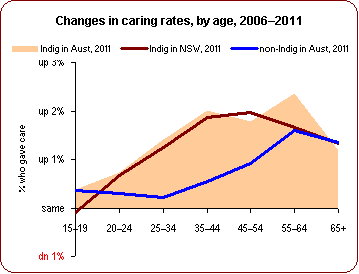 |
||||||||||||
| Among all Australia adults, caring rates changed little. | ||||||||||||||
| z | Locally, Indigenous caring rates increased most among 5564 year-olds, from 14% in 2006 to 16% in 2011. | |||||||||||||
| Local carer rates also rose 2% among 3544 year-olds and 2% among 4554 year-olds. | ||||||||||||||
| Local rates rose least among those aged 1519 year-olds (steady), and 2024, up by just 1%. | ||||||||||||||
| Disability Gap Indicators | ||||||||||||||
| The disability gap | Indicator: % of adults with a chronic, severe disability | |||||||||||||
| Disability rates provide a useful indicator of a community's health and need for support services. Nationally, disability rates among Indigenous people are about 25% higher than for others, across most age groups. | ||||||||||||||
| z | In 2011, 5.4% of Australia Indigenous residents had a severe, chronic disability, compared with 4.6% for all residents. The disability gap was 0.7%. The local Indigenous disability rate was 16% higher. | 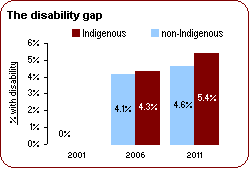 |
||||||||||||
| z | The disability gap had widened by 0.6% since 2006. | |||||||||||||
| In the Census count, people with disabilities are those with a severe or profound disability lasting more than 6 months, who required help with daily activities, self-care or communicating. Data on disability was not collected in the 2001 Census. | ||||||||||||||
| The carer difference | Indicator: % of adults caring for a person with a disability | |||||||||||||
| The proportion of people providing assistance to another with severe, chronic disability is probably more a reflection of the number of people with disabilities than of people's caring nature. Indigenous people have higher disability rates and larger families, so can have proportionally more carers. | ||||||||||||||
| z | In 2011, 13% of Australia Indigenous adults provided assistance to another with a severe, chronic disability, compared with 11% for non-Indigenous adults. The carer difference was 2%. | 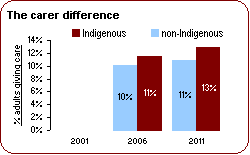 |
||||||||||||
| z | The carer difference had changed little since 2006. | |||||||||||||
| Adults here are
aged 15 or over. Data was not collected in the 2001 Census. |
||||||||||||||
